


In this report I will first analyze the Google Dataflow cloud service, justifying its usefulness in different business contexts where data processing is a key element for market analysis and decision making. I will conclude by testing this platform, analyzing in batch mode the public dataset on COVID-19 cases issued in official form by the “Dipartimento delle protezione civile” (Italian dataset), structuring a pipeline for statistical analysis on the number of cases for each Italian province.
G. Mancusi
Introduction
Companies today have an enormous amount of data at their disposal. This is due to the massive growth of sources that generate data streams. These sources can, for example, be log data from server applications, data analyzing the clickstream of mobile applications and websites, or the huge amount of data from IoT devices, but also all databases that receive input day after day on a continuous basis. I share the idea that this data, when analyzed, turns out to be important information that concretely helps companies to understand the interests of customers, the behavior of applications, and to have an overview of the performance of their products on the market.
Another case of use in vogue in this period is for machine learning, which becomes more reactive and actionable by the market data provided by applications in a few moments instead of manually, in days and weeks.
Batch and Stream Analysis
Companies work to be effective in the market. To do this they need tools to study the constant change. For this purpose, it is necessary to collect, prepare, and process the data acquired in real-time without interruption. The traditional analysis to which we have been accustomed over the years consisted in recovering the data, periodically uploading it to data warehouses, and analyzing it hours, days or weeks later, not allowing the board of directors of a company to receive quick answers to the questions asked by the market. Analyzing data in real-time requires a different approach. In fact, instead of querying previously stored data, it is necessary to perform the analysis continuously, in real-time, even before storing the flow. The peculiarity is that the data stream can arrive in proportion to the number of users using the software product and for this reason, we have, also in this case, the need to scale according to market demand. The services that manage the processing of the stream data must be able to handle the speed and variability of the stream data.
Google Cloud Dataflow
To solve the scalability problem you can switch to the cloud and use Google Dataflow. This service performs a wide variety of data processing patterns, both batch type, which is useful for periodically updated data, and stream type, which is targeted to continuously updated sources.
Dataflow uses the open-source SDK called Apache Beam, with which you can create a pipeline – i.e. concatenated transformations to be performed on the data – through a program written in Java, Python or Go, and then run it in a Dataflow service. Unfortunately on the web, the support community for python is lacking in information, in fact, most of the code reported in the answers to the questions was written in Java, which I noticed to be more supported and have a more feature-rich SDK than the python SDK. While I believe that support for Java is essential because it is one of the best known and used languages, I think python should be better supported, in fact, I think it is more suitable for the purpose because it is more flexible and dynamic than Java. These are fundamental characteristics to write elastic pipelines.
I would like to add that Google’s Dataflow surprised me in the granularity and simplicity with which it allowed me to monitor information on the status of the on-going job. I could imagine that at that moment in the Google datacenter of the machines were really working on my pipeline data with a distributed and scalable methodology.

Apache Beam
In order to deepen the technology, it is necessary to study its foundations. Dataflow uses Apache Beam to define the execution pipeline. In order to understand this Google service, it was, therefore, necessary for me to dissect the documentation and guides on the Apache Beam SDK web portal.
I like the abstractions provided by Apache Beam, which make it easy to define the logic of large scale data processing, both batch, and stream type.
During the study I identified three key components with which I was able to build different types of pipeline architectures for data processing. The classes that manage these components are: Pipeline, PCollection and PTransform. As you can see from the following diagram, you can compose any pipeline with the instances of these classes.


The first component is the instance of the abstract Pipeline class (in yellow), which encapsulates the entire data processing task, from start to finish, whatever form it takes. The pipeline contains input data read operations (from any source), data transformations, and data output operations on any external storage. [3]
The second component is the PCollection (in blue), whose task is to contain and encapsulate the data in such a way as to respect certain properties that these must satisfy in order to be processed by the pipeline and binds the developer to apply these characteristics.
The third component is the PTransform (in red), which is a data processing operation. This is applied to an input PCollection for each step in the pipeline and produces zero or more PCollection type outputs for the next step.
After defining a pipeline with Apache Beam you will need to release the code on Google Dataflow and run it through a simple console command.
Statistics on COVID-19 using Dataflow
Experimenting with this technology means working and processing a lot of data. In the first instance, therefore, I asked myself where I could find this amount of data, but especially data that made sense and that if processed could be useful for a purpose. At this point, I decided to tackle a current topic of which we listen dramatically to the news every day on the news. I, therefore, chose to download the dataset on the COVID-19 data officially issued by the Italian Civil Protection Department [1]. The goal was to use Dataflow to output statistical information related to the contagions of this virus. I chose to publish the work online, on GitHub [0], giving all developers the opportunity to take it as an example or possibly to contribute to its improvement.
The link to access the project is as follows: https://github.com/GianlucaMancusi/COVID-19-Apache-Beam-Statistics
The PCM-DPC dataset is organized in several files. The one I decided to use is the most granular file that contains the daily data on the COVID-19 of each Italian province. It contains more than 7000 lines of files in CSV format and continues to grow day after day.
I will now proceed to describe the dataset in order to clarify how I will use it.
The CSV file is presented with the following header:
data, stato, codice_regione, denominazione_regione, codice_provincia, denominazione_provincia, sigla_provincia, lat, long, totale_casi, note_it, note_en
In bold are the data I used for the analysis through Apache Beam. The goal was to write an Apache Beam driver that could be run without problems on Google Dataflow, extracting in output for each region and for each province, the average, the variance, the standard deviation of the cases, a descending ordered list of the top N of the daily number of cases (where N is specified via console parameter) and information on the total number of cases for the last date present in the dataset.
In particular, this calculation must be performed on a pipeline that, after taking the dataset as input, must branch out to calculate this information in parallel and merge it into output. The output format will be in JSON Lines that allows typing and nested objects, it is a valid substitute to the common CSV format.
Batch pipeline design for analysis on COVID-19
Before writing the code you must design the pipeline. I found it satisfying how demanding and at the same time complete the reading on the Apache Beam website [6] that illustrates the correct way to design a pipeline that has all the execution features runners need.
I believe and propose that a useful approach to properly structuring a pipeline is to think backward. You have to ask yourself: “What do I want in output?”, and consequently find the list of operations to make each element of the output until you join the operations in the input.
Below I have inserted the simplified diagram of the macro transformations of the project pipeline. I write “macro” transformations because a transformation can be defined as a set of many transformations.


For example, the Parsing blocks have other transformations internally, for example, that of grouping by “region-province”.
The pipeline steps are as follows:
- I take the CSV file from Google Storage and create a PCollection instance with the data inside it (they will be automatically distributed on multiple instances of Compute Engine).
- On the PCollection instance, I apply two parallel transformations (ParDos) to read the CSV format and group them directly by Region and Province (in the second case where I wrote “+Date” I also add the date).
- I apply the 3 custom macro transformations in parallel.
- I encode and write the output in JsonLines.
An example of output is as follows:
…
["Emilia-Romagna,Modena", {"cases_statistics": [{"mean": 1320.6851851851852, "variance": 1472316.4749657065, "stddev": 1213.3904874217972}], "top_3_cases": [[3301, 3262, 3217]], "last_data": [{"date": "2020-04-17", "cases": 3301}]}]
…
Implementation of the pipeline on COVID-19 in Apache Beam SDK using python
The library that is used to interface to Apache Beam via python is named as “apache_beam”, which allows you to write the code with a syntax that is very similar to Unix-Pipelines, i.e. with the operator “|”. In fact, given the object of a pipeline p it is possible to concatenate the operations in this way: p | reading | transformation1 | transformation 2 | output.
Most of the project code was written to define custom transformation classes that implement basic transformation interfaces. To develop these transformations, it was enough to write the override of the abstract methods and implement them according to the logic described in the documentation. The most complex part was to define new combiners, just in analogy to those present in the map reduce algorithms, bearing in mind that in this case the operations to be performed must have the commutative and associative property and remembering that some operations are performed having the data on separate machines, for this reason it is not always possible to have all the datasets at hand and you must use accumulators even and only to search for example, the most recent date among all.
The easiest way to solve the problem of obtaining these outputs from distributed computing was to define multiple pipelines and then link them together.
Having defined a P0 pipeline, we can branch out this pipeline into two new separate branches creating two new P1 and P2 pipelines starting from P0.
P0 = op01 | op02 | …
then:
P1 = P0 | op11 | op12 | …
P2 = P0 | op21 | op22 | …


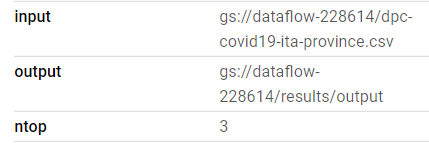
The python script that includes the pipeline can be called from the command line with the –output, –input and –ntop options. The latter option allows you to define the number of items in the ranking of daily cases by province to be shown.
At this link you can see the pipeline implementation for the COVID-19.
Release of the COVID-19 pipeline on Google Dataflow
Once you have completed the pipeline definition phase with the Beam driver and after debugging in the local machine through the DirectRunner, you can release the pipeline on Google Dataflow simply by invoking the same command to start the python script locally but adding the options to specify the configuration for the Dataflow runner.
Additional options to specify are “–project”, “–runner”, “–temp_location”, “–job_name”, “–region”.
An example of usage is as follows:


After executing this command, by opening Dataflow Monitoring Interface from the Google Cloud Platform Console, it will be possible to see in real-time the construction of the scheme and the status of each node of the pipeline during the Graph Construction Time, being able to receive instant feedback. The interface also allows you to click on each node to receive detailed information.
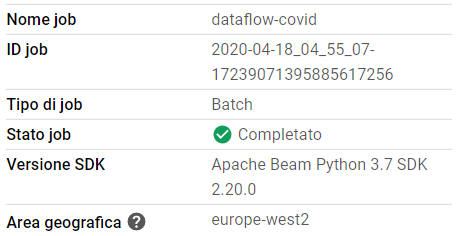
The general status of the Job after transformations:

More details on the execution of the Job


I
I also insert the result of the graph generated by Dataflow related to the pipeline, which I think is interesting to analyze especially in the form. These results are consistent with what I had previously described in an abstract way with a simple diagram.
Being able to click on every node it is possible to see how Google is able to calculate some estimates on the use of the memory of these nodes and how it is able to foresee the number of workers that will be used for the resolution of the Job.
Finally, you can analyze the output that is broken into as many files as the number of workers used to complete the Job.


From the output, which I made available on GitHub, you can see and analyze the overall situation due to COVID-19 province by province. I’ll add that it would be possible to improve the script with many other calculations and pipelines that, in a very direct way, can be added as parallel subsets in the transformation graph.
Conclusions
I am quite satisfied with the results obtained on the topic of COVID-19, where the data acquire a strong informative content considering the current situation we are experiencing day after day. I firmly believe that the analysis of data in this pandemic situation is essential in order to implement effective contingency plans. Indeed, working with the datasets currently available, it is possible to obtain information that can influence the political choices made by countries. When the number of files to be analyzed is excessive, it is good to think about transferring the computational load to the cloud in order to get answers in a reasonable time. This is an essential requirement to allow people to get back out of the house as soon as possible.